Power BI Desktop
Introduction
“Welcome back! In this lesson, we’re focusing on Power BI Desktop—the primary application you’ll use to build your data models, create visuals, and design interactive reports. Let’s look at how to set it up, navigate its interface, and connect to a sample data source.”
Installing Power BI Desktop
- Download Location: “You can download Power BI Desktop for free from the official Microsoft website or through the Microsoft Store on Windows 10 or later.”
- Installation Process: “Once downloaded, run the installer and follow the on-screen prompts. When prompted, choose your preferred language, accept the license agreement, and select the installation folder.”
- System Requirements: “Make sure your computer meets the recommended system requirements—enough RAM (at least 4 GB, ideally more) and a recent Windows operating system.”
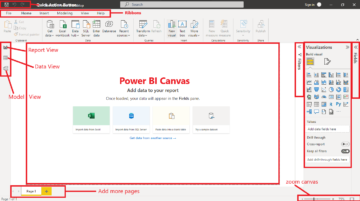
Navigating the Interface
- Ribbon: “At the top of the window, you’ll see tabs like ‘Home,’ ‘View,’ and ‘Modeling,’ which provide quick access to core features.”
- Fields Pane: “On the right, you’ll see the Fields pane showing the tables and columns in your current data model.”
- Visualisations Pane: “Next to the Fields pane, you’ll find a library of built-in charts, tables, and other visuals you can drag onto the canvas.”
- Canvas Area: “This is where you design your report by placing visuals, text boxes, and shapes. You can switch between Report View, Data View, and Model View using icons on the left sidebar.”
Understanding the Report, Data, and Model Views
- Report View: “Where you’ll spend most of your time creating visuals and arranging them into pages.”
- Data View: “Lets you see individual tables in a spreadsheet-like format, making it easier to spot-check or modify certain columns.”
- Model View: “Allows you to manage relationships between tables and configure data properties like data types and default summarisations.”
Lesson Recap
“We’ve covered the basics of downloading, installing, and navigating Power BI Desktop. You now know how to connect to your first data source and start shaping your data. These foundational skills are crucial for building more advanced reports as we progress through the course.”
Coming Up Next
“Next, we’ll move deeper into data preparation and modeling. We’ll explore how to clean your data in the Power Query Editor, set up relationships among different tables, and decide whether to use Import or DirectQuery mode. See you in the next module!”